


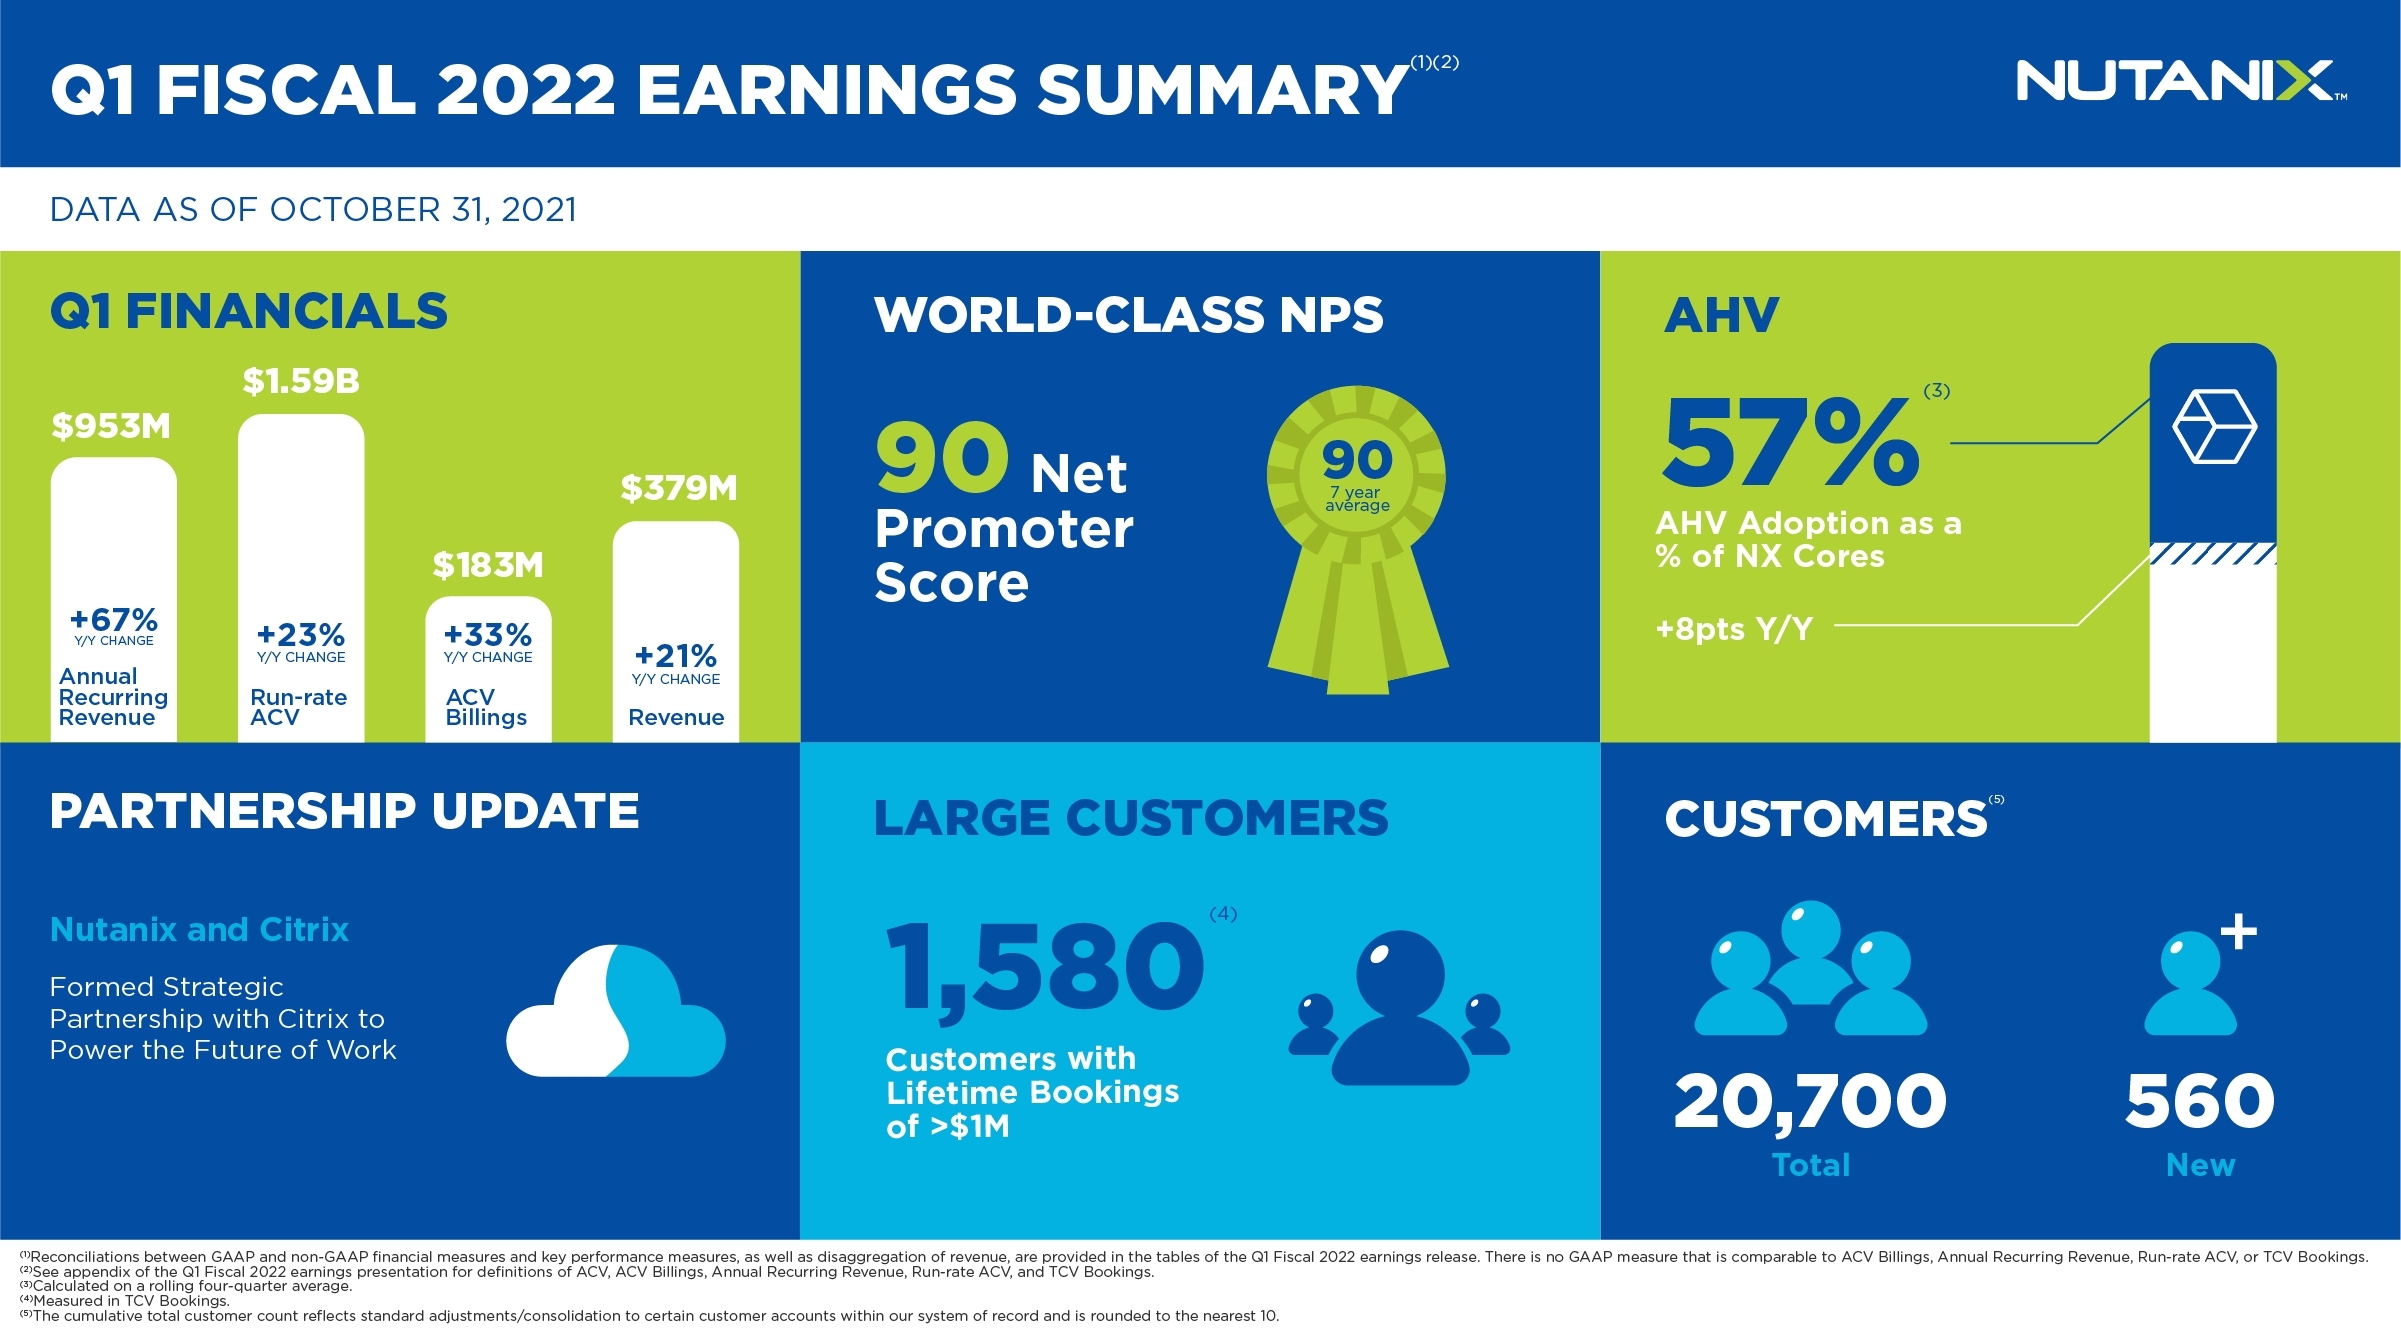
Delivers 33% YoY ACV Billings Growth and 21% YoY Revenue Growth
Drives Outperformance Across All Guided Metrics With Continued Execution on Hybrid Multicloud Vision
SAN JOSE, Calif.–(BUSINESS WIRE)–Nutanix, Inc. (NASDAQ: NTNX), a leader in hybrid multicloud computing, today announced financial results for its first quarter ended October 31, 2021.
“Our first quarter was a good start to our fiscal year, demonstrating strong year-over-year top and bottom-line improvement,” said Rajiv Ramaswami, President and CEO of Nutanix. “We continued to execute towards our targets of free cash flow break-even in the second half of calendar 2022 and a 25 percent-plus ACV billings CAGR through fiscal 2025.”
“In our first quarter, we achieved record ACV billings, which grew 33 percent year-over-year, and saw 21 percent year-over-year revenue growth, our highest growth in over three years,” said Duston Williams, CFO of Nutanix. “With the continued progress we’ve made on our subscription model, we believe it’s now appropriate to provide annual guidance. Additionally, having gained a better understanding of potential fluctuations in our average contract term lengths, we are guiding to revenue, on both a quarterly and annual basis.”
First Quarter Fiscal 2022 Financial Summary
|
|
Q1 FY’22 |
Q1 FY’21 |
Y/Y Change |
|||
|
Annual Contract Value (ACV)1 Billings |
$183.3 million |
$137.8 million |
33% |
|||
|
Annual Recurring Revenue (ARR)2 |
$952.6 million |
$569.5 million |
67% |
|||
|
Run-rate Annual Contract Value (ACV)3 |
$1.59 billion |
$1.29 billion |
23% |
|||
|
Average Contract Term4 |
3.1 years |
3.5 years |
(0.4) year |
|||
|
Revenue5 |
$378.5 million |
$312.8 million |
21% |
|||
|
GAAP Gross Margin |
78.5% |
78.3% |
20 bps |
|||
|
Non-GAAP Gross Margin |
82.1% |
81.9% |
20 bps |
|||
|
GAAP Operating Expenses |
$434.3 million |
$426.9 million |
2% |
|||
|
Non-GAAP Operating Expenses |
$352.6 million |
$341.2 million |
3% |
|||
|
Free Cash Flow |
$(1.9) million |
$(16.3) million |
$14.4 million |
Reconciliations between GAAP and non-GAAP financial measures and key performance measures, to the extent available, are provided in the tables of this press release.
Recent Company Highlights
- Formed Strategic Partnership with Citrix to Power the Future of Work: Nutanix and Citrix announced a strategic partnership to provide secure, on-demand, and elastic access to apps, desktops, and data from any device, in any location, at any scale through Nutanix hyperconverged infrastructure (HCI) and hybrid multicloud deployments of Citrix DaaS and Virtual Apps and Desktops services.
- Received Recognition from Gartner for Both Core and Emerging Products6: Nutanix was named as a leader in Gartner, Inc.’s Magic Quadrant for Hyperconverged Infrastructure for the fifth time in a row. Nutanix was also named for the first time in Gartner’s October 2021 Gartner Magic Quadrant for Distributed Files and Objects Storage as a Visionary.
- Appointed Dominick Delfino as Chief Revenue Officer: Nutanix announced that it appointed Dominick Delfino to lead the Company’s worldwide sales organization, including sales engineering, sales operations, inside sales, OEM sales, and channel sales, effective December 6, 2021. Mr. Delfino brings more than 20 years of global sales experience, having led software sales and system engineering teams at multiple technology and software companies.
- Appointed Anja Hamilton as Chief People Officer: Nutanix announced that it named Anja Hamilton as Chief People Officer, effective January 4, 2022. She will be responsible for the Company’s global people strategy and operations as Nutanix continues to attract, support and retain top talent. Rukmini Sivaraman, Chief People Officer and SVP of Strategic Finance, will transition to SVP of Finance and Planning and report to Chief Financial Officer, Duston Williams.
- Hosted .NEXT Digital Experience: Nutanix hosted its signature customer event where it saw a record number of new Nutanix professional certifications and viewership of keynotes and breakout sessions.
- Announced New Capabilities for Nutanix’s Cloud Platform: Nutanix launched AOS 6.0 with new integrated, zero-trust security, disaster recovery and virtual networking innovations. The Company also introduced new capabilities that make it easier for customers to simplify data management and optimize database and big data workload performance on the Nutanix Cloud Platform.
Second Quarter Fiscal 2022 Outlook
|
|
|
|
ACV Billings |
$195 – $200 million |
|
Revenue |
$400 – $410 million |
|
Non-GAAP Gross Margin |
Approximately 82% to 82.5% |
|
Non-GAAP Operating Expenses |
$360 – $365 million |
|
Weighted Average Shares Outstanding |
Approximately 218 million |
Fiscal 2022 Outlook
|
|
|
|
ACV Billings |
$740 – $750 million |
|
Revenue |
$1.615 – $1.630 billion |
|
Non-GAAP Gross Margin |
Approximately 82% |
|
Non-GAAP Operating Expenses |
$1.48 – $1.49 billion |
Supplementary materials to this press release, including our first quarter fiscal 2022 earnings presentation, can be found at https://ir.nutanix.com/company/financial.
Webcast and Conference Call Information
Nutanix executives will discuss the company’s first quarter fiscal 2022 financial results on a conference call at 4:30 p.m. Eastern Time/1:30 p.m. Pacific Time. To listen to the call via telephone, dial 1-833-227-5841 from within the United States or 1-647-689-4068 from outside the United States. The conference ID is 3340038. This call will be webcast live and available to all interested parties on our Investor Relations website at ir.nutanix.com. Shortly after the conclusion of the conference call, a replay of the audio webcast will be available on our Investor Relations website. A telephonic replay will be available for one week and can be accessed by calling 1-800-585-8367 or 1-416-621-4642, and entering the conference ID 3340038.
Definitions and Total Revenue Impact
1Annual Contract Value, or ACV, is defined as the total annualized value of a contract, excluding amounts related to professional services and hardware. The total annualized value for a contract is calculated by dividing the total value of the contract by the number of years in the term of such contract, using, where applicable, an assumed term of five years for contracts that do not have a specified term. ACV Billings, for any given period, is defined as the sum of the ACV for all contracts billed during the given period. ACV Billings is the sum of New ACV Billings and Renewals ACV Billings.
2Annual Recurring Revenue, or ARR, for any given period, is defined as the sum of ACV for all non life-of-device contracts in effect as of the end of a specific period. For the purposes of this calculation, the Company assumes that the contract term begins on the date a contract is booked, unless the terms of such contract prevent us from fulfilling our obligations until a later period, and irrespective of the periods in which the Company would recognize revenue for such contract.
3Run-rate ACV, at the end of any period, is the sum of ACV for all contracts that are in effect as of the end of that period. For the purposes of this calculation, the Company assumes that the contract term begins on the date a contract is booked, irrespective of the periods in which the Company would recognize revenue for such contract.
4Average Contract Term represents the dollar-weighted term, calculated on a billings basis, across all subscription and life-of-device contracts, using an assumed term of five years for life-of-device licenses, executed in the period.
5Revenue was negatively impacted by a year-over-year decline in the average contract term associated with Nutanix’s ongoing transition to a subscription-based business model.
6Gartner, Magic Quadrant for Hyperconverged Infrastructure Software, Jeffrey Hewitt, Philip Dawson, Julia Palmer, Tony Harvey, 17 November, 2021. Gartner, Magic Quadrant for Distributed File Systems and Object Storage, Julia Palmer, Jerry Rozeman, Chandra Mukhyala, Jeff Vogel, 1 October, 2021.
Non-GAAP Financial Measures and Other Key Performance Measures
To supplement our consolidated financial statements, which are prepared and presented in accordance with GAAP, we use the following non-GAAP financial and other key performance measures: billings, non-GAAP gross margin, non-GAAP operating expenses, non-GAAP net loss, non-GAAP net loss per share, free cash flow, subscription revenue, subscription billings, Annual Contract Value Billings (or ACV Billings), Annual Recurring Revenue (or ARR), and Run-rate Annual Contract Value (or Run-rate ACV). In computing these non-GAAP financial measures and key performance measures, we exclude certain items such as stock-based compensation and the related income tax impact, costs associated with our acquisitions (such as amortization of acquired intangible assets, income tax-related impact, and other acquisition-related costs), impairment of operating lease-related assets, the change in fair value of the derivative liability, the amortization of the debt discount and issuance costs, non-cash interest expense, other non-recurring transactions and the related tax impact, and the revenue and billings associated with pass-through hardware sales. Billings is a performance measure which we believe provides useful information to investors because it represents the amounts under binding purchase orders received by us during a given period that have been billed, and we calculate billings by adding the change in deferred revenue between the start and end of the period to total revenue recognized in the same period. Non-GAAP gross margin, non-GAAP operating expenses, non-GAAP net loss, and non-GAAP net loss per share are financial measures which we believe provide useful information to investors because they provide meaningful supplemental information regarding our performance and liquidity by excluding certain expenses and expenditures such as stock-based compensation expense that may not be indicative of our ongoing core business operating results. Free cash flow is a performance measure that we believe provides useful information to our management and investors about the amount of cash generated by the business after necessary capital expenditures, and we define free cash flow as net cash provided by (used in) operating activities less purchases of property and equipment. Subscription revenue and subscription billings are performance measures that we believe provide useful information to our management and investors as they allow us to better track the growth of the subscription-based portion of our business, which is a critical part of our business plan. ACV Billings and Run-rate ACV are performance measures that we believe provide useful information to our management and investors as they allow us to better track the topline growth of our business during our transition to a subscription-based business model because they take into account variability in term lengths. ARR is a performance measure that we believe provides useful information to our management and investors as it allows us to better track the topline growth of our subscription business because it takes into account variability in term lengths. We use these non-GAAP financial and key performance measures for financial and operational decision-making and as a means to evaluate period-to-period comparisons. However, these non-GAAP financial and key performance measures have limitations as analytical tools and you should not consider them in isolation or as substitutes for analysis of our results as reported under GAAP. Billings, non-GAAP gross margin, non-GAAP operating expenses, non-GAAP net loss, non-GAAP net loss per share, and free cash flow are not substitutes for total revenue, gross margin, operating expenses, net loss, net loss per share, or net cash provided by (used in) operating activities, respectively; subscription revenue is not a substitute for total revenue; and subscription billings is not a substitute for subscription revenue. There is no GAAP measure that is comparable to ACV Billings, ARR, or Run-rate ACV, so we have not reconciled the ACV Billings, ARR, or Run-rate ACV numbers included in this press release to any GAAP measure. In addition, other companies, including companies in our industry, may calculate non-GAAP financial measures and key performance measures differently or may use other measures to evaluate their performance, all of which could reduce the usefulness of our non-GAAP financial measures and key performance measures as tools for comparison. We urge you to review the reconciliation of our non-GAAP financial measures and key performance measures to the most directly comparable GAAP financial measures included below in the tables captioned “Reconciliation of Revenue to Billings,” “Disaggregation of Revenue and Billings,” “Reconciliation of Subscription and Professional Services Revenue to Subscription and Professional Services Billings,” “Reconciliation of GAAP to Non-GAAP Profit Measures,” and “Reconciliation of GAAP Net Cash Provided By (Used In) Operating Activities to Non-GAAP Free Cash Flow,” and not to rely on any single financial measure to evaluate our business.
Forward-Looking Statements
This press release contains express and implied forward-looking statements, including, but not limited to, statements regarding: our business plans, strategies, initiatives, vision, objectives, and outlook (including our growth plan and vision of making clouds invisible) as well as our ability to execute thereon successfully and in a timely manner and the benefits and impact thereof on our business, operations, and financial results (including our second quarter fiscal 2022 outlook, our fiscal 2022 outlook, and our continued execution towards our targets of free cash flow break-even in the second half of calendar 2022 and a 25 percent-plus ACV billings CAGR through fiscal 2025); our plans for, and the timing of, any current and future business model transitions, including our ongoing transition to a subscription-based business model, our ability to manage, complete or realize the benefits of such transitions successfully and in a timely manner, and the short-term and long-term impacts of such transitions on our business, operations and financial results; the competitive market, including our competitive position and ability to compete effectively, the competitive advantages of our products, our projections about our market share and opportunity, and the effects of increased competition in our market; our ability to attract new end customers and retain and grow sales from our existing end customers; our customer needs and our response to those needs; our ability to form new, and maintain and strengthen existing, strategic alliances and partnerships, including our relationships with our channel partners and original equipment manufacturers, and the impact of any changes to such relationships on our business, operations and financial results; the benefits and capabilities of our platform, solutions, products, services and technology, including the interoperability and availability of our solutions with and on third-party platforms; our plans and expectations regarding new solutions, products, services, product features and technology, including those that are still under development or in process; our plans regarding, and the timing and success of, our customer, partner, industry, analyst, investor and employee events and the impact thereof on our business, operations, and financial results; the timing and potential impact of the COVID-19 pandemic on the global market environment and the IT industry, as well as on our business, operations and financial results, including the changes we have made or anticipate making in response to the COVID-19 pandemic, our ability to manage our business during the pandemic, and the position we anticipate being in following the pandemic; our decision to use new or different metrics, or to make adjustments to the metrics we use, to supplement our financial reporting, and the impact thereof; and our guidance on estimated ACV Billings, non-GAAP gross margin, non-GAAP operating expenses, and weighted average shares outstanding for any future fiscal periods.
These forward-looking statements are not historical facts and instead are based on our current expectations, estimates, opinions, and beliefs. Consequently, you should not rely on these forward-looking statements. The accuracy of these forward-looking statements depends upon future events and involves risks, uncertainties, and other factors, including factors that may be beyond our control, that may cause these statements to be inaccurate and cause our actual results, performance or achievements to differ materially and adversely from those anticipated or implied by such statements, including, among others: failure to successfully implement or realize the full benefits of, or unexpected difficulties or delays in successfully implementing or realizing the full benefits of, our business plans, strategies, initiatives, vision, and objectives; our ability to achieve, sustain and/or manage future growth effectively; delays or unexpected accelerations in our current and future business model transitions; the rapid evolution of the markets in which we compete, including the introduction, or acceleration of adoption of, competing solutions, including public cloud infrastructure; failure to timely and successfully meet our customer needs; delays in or lack of customer or market acceptance of our new solutions, products, services, product features or technology; the timing, breadth, and impact of the COVID-19 pandemic on our business, operations, and financial results, as well as the impact on our customers, partners, and end markets; factors that could result in the significant fluctuation of our future quarterly operating results, including, among other things, anticipated changes to our revenue and product mix, including changes as a result of our transition to a subscription-based business model, which will slow revenue growth during such transition and make forecasting future performance more difficult, the timing and magnitude of orders, shipments and acceptance of our solutions in any given quarter, our ability to attract new and retain existing end-customers, changes in the pricing and availability of certain components of our solutions, and fluctuations in demand and competitive pricing pressures for our solutions; and other risks detailed in our Annual Report on Form 10-K for the fiscal year ended July 31, 2021, filed with the U.S. Securities and Exchange Commission, or the SEC, on September 21, 2021. Additional information will also be set forth in our Quarterly Report on Form 10-Q for the fiscal quarter ended October 31, 2021, which should be read in conjunction with this press release and the financial results included herein. Our SEC filings are available on the Investor Relations section of our website at ir.nutanix.com and on the SEC’s website at www.sec.gov. These forward-looking statements speak only as of the date of this press release and, except as required by law, we assume no obligation, and expressly disclaim any obligation, to update, alter or otherwise revise any of these forward-looking statements to reflect actual results or subsequent events or circumstances.
About Nutanix
Nutanix is a global leader in cloud software and a pioneer in hyperconverged infrastructure solutions, making clouds invisible, freeing customers to focus on their business outcomes. Organizations around the world use Nutanix software to leverage a single platform to manage any app at any location for their hybrid multicloud environments. Learn more at www.nutanix.com or follow us on social media @nutanix.
© 2021 Nutanix, Inc. All rights reserved. Nutanix, the Nutanix logo, and all Nutanix product and service names mentioned herein are registered trademarks or trademarks of Nutanix, Inc. in the United States and other countries. Other brand names mentioned herein are for identification purposes only and may be the trademarks of their respective holder(s). This press release contains links to external websites that are not part of Nutanix.com. Nutanix does not control these sites and disclaims all responsibility for the content or accuracy of any external site. Our decision to link to an external site should not be considered an endorsement of any content on such a site.
|
NUTANIX, INC. CONDENSED CONSOLIDATED BALANCE SHEETS (Unaudited) |
||||||||
|
|
|
As of |
|
|||||
|
|
|
July 31, |
|
|
October 31, |
|
||
|
|
|
(in thousands) |
|
|||||
|
Assets |
|
|
|
|
|
|
||
|
Current assets: |
|
|
|
|
|
|
||
|
Cash and cash equivalents |
|
$ |
285,723 |
|
|
$ |
350,985 |
|
|
Short-term investments |
|
|
928,006 |
|
|
|
925,116 |
|
|
Accounts receivable, net |
|
|
180,781 |
|
|
|
116,944 |
|
|
Deferred commissions—current |
|
|
110,935 |
|
|
|
110,468 |
|
|
Prepaid expenses and other current assets |
|
|
56,816 |
|
|
|
48,882 |
|
|
Total current assets |
|
|
1,562,261 |
|
|
|
1,552,395 |
|
|
Property and equipment, net |
|
|
131,621 |
|
|
|
120,596 |
|
|
Operating lease right-of-use assets |
|
|
105,903 |
|
|
|
100,665 |
|
|
Deferred commissions—non-current |
|
|
232,485 |
|
|
|
239,177 |
|
|
Intangible assets, net |
|
|
32,012 |
|
|
|
27,885 |
|
|
Goodwill |
|
|
185,260 |
|
|
|
185,260 |
|
|
Other assets—non-current |
|
|
27,954 |
|
|
|
28,588 |
|
|
Total assets |
|
$ |
2,277,496 |
|
|
$ |
2,254,566 |
|
|
Liabilities and Stockholders’ Deficit |
|
|
|
|
|
|
||
|
Current liabilities: |
|
|
|
|
|
|
||
|
Accounts payable |
|
$ |
47,056 |
|
|
$ |
43,184 |
|
|
Accrued compensation and benefits |
|
|
162,337 |
|
|
|
122,372 |
|
|
Accrued expenses and other current liabilities |
|
|
39,404 |
|
|
|
33,509 |
|
|
Deferred revenue—current |
|
|
636,421 |
|
|
|
662,501 |
|
|
Operating lease liabilities—current |
|
|
42,670 |
|
|
|
43,221 |
|
|
Total current liabilities |
|
|
927,888 |
|
|
|
904,787 |
|
|
Deferred revenue—non-current |
|
|
676,502 |
|
|
|
670,833 |
|
|
Operating lease liabilities—non-current |
|
|
86,599 |
|
|
|
77,675 |
|
|
Convertible senior notes, net |
|
|
1,055,694 |
|
|
|
1,261,656 |
|
|
Derivative liability |
|
|
500,175 |
|
|
|
— |
|
|
Other liabilities—non-current |
|
|
42,679 |
|
|
|
38,354 |
|
|
Total liabilities |
|
|
3,289,537 |
|
|
|
2,953,305 |
|
|
Stockholders’ deficit: |
|
|
|
|
|
|
||
|
Common stock |
|
|
5 |
|
|
|
5 |
|
|
Additional paid-in capital |
|
|
2,615,317 |
|
|
|
3,292,255 |
|
|
Accumulated other comprehensive income |
|
|
(8 |
) |
|
|
(659 |
) |
|
Accumulated deficit |
|
|
(3,627,355 |
) |
|
|
(3,990,340 |
) |
|
Total stockholders’ deficit |
|
|
(1,012,041 |
) |
|
|
(698,739 |
) |
|
Total liabilities and stockholders’ deficit |
|
$ |
2,277,496 |
|
|
$ |
2,254,566 |
|
|
NUTANIX, INC. CONDENSED CONSOLIDATED STATEMENTS OF OPERATIONS (Unaudited) |
|||||||
|
|
Three Months Ended |
||||||
|
|
|
2020 |
|
|
|
2021 |
|
|
|
(in thousands, except per share data) |
||||||
|
Revenue: |
|
|
|
||||
|
Product |
$ |
155,752 |
|
|
$ |
180,105 |
|
|
Support, entitlements and other services |
|
157,002 |
|
|
|
198,412 |
|
|
Total revenue |
|
312,754 |
|
|
|
378,517 |
|
|
Cost of revenue: |
|
|
|
||||
|
Product (1)(2) |
|
12,814 |
|
|
|
14,221 |
|
|
Support, entitlements and other services (1) |
|
55,145 |
|
|
|
67,225 |
|
|
Total cost of revenue |
|
67,959 |
|
|
|
81,446 |
|
|
Gross profit |
|
244,795 |
|
|
|
297,071 |
|
|
Operating expenses: |
|
|
|
||||
|
Sales and marketing (1)(2) |
|
257,290 |
|
|
|
250,033 |
|
|
Research and development (1) |
|
135,804 |
|
|
|
144,266 |
|
|
General and administrative (1) |
|
33,774 |
|
|
|
40,028 |
|
|
Total operating expenses |
|
426,868 |
|
|
|
434,327 |
|
|
Loss from operations |
|
(182,073 |
) |
|
|
(137,256 |
) |
|
Other expense, net |
|
(78,732 |
) |
|
|
(278,549 |
) |
|
Loss before provision for income taxes |
|
(260,805 |
) |
|
|
(415,805 |
) |
|
Provision for income taxes |
|
4,243 |
|
|
|
4,047 |
|
|
Net loss |
$ |
(265,048 |
) |
|
$ |
(419,852 |
) |
|
Net loss per share attributable to Class A and Class B |
$ |
(1.31 |
) |
|
$ |
(1.95 |
) |
|
Weighted average shares used in computing net loss |
|
203,095 |
|
|
|
215,499 |
|
|
_______________________ (1) Includes the following stock-based compensation expense: |
|||||||
|
|
Three Months Ended |
||||||
|
|
|
2020 |
|
|
|
2021 |
|
|
|
(in thousands) |
||||||
|
Product cost of revenue |
$ |
1,504 |
|
|
$ |
1,751 |
|
|
Support, entitlements and other services cost of revenue |
|
5,761 |
|
|
|
8,451 |
|
|
Sales and marketing |
|
32,227 |
|
|
|
29,132 |
|
|
Research and development |
|
37,887 |
|
|
|
38,479 |
|
|
General and administrative |
|
11,819 |
|
|
|
12,734 |
|
|
Total stock-based compensation expense |
$ |
89,198 |
|
|
$ |
90,547 |
|
|
(2) Includes the following amortization of intangible assets: |
|||||||
|
|
Three Months Ended |
||||||
|
|
|
2020 |
|
|
|
2021 |
|
|
|
(in thousands) |
||||||
|
Product cost of revenue |
$ |
3,694 |
|
|
$ |
3,476 |
|
|
Sales and marketing |
|
651 |
|
|
|
651 |
|
|
Total amortization of intangible assets |
$ |
4,345 |
|
|
$ |
4,127 |
|
Contacts
Investor Contact:
Richard Valera
ir@nutanix.com
Media Contact:
Jennifer Massaro
pr@nutanix.com


