


 robotics & automation adoption")
With the ongoing digitalisation of modern life, the retail landscape has undergone quite a transformation over the last few years, making e-commerce an essential part of the global retail industry. As a result, both e-commerce and the mobile robotic market are seeing rapid growth. Despite the global economic uncertainty at the moment, e-commerce will keep growing and is expected to account for 22% of all retail sales worldwide in 2023 — compared to the 14.1% back in 2019.
Not only can we see the impact of digitalisation reflected in the retail industry, but warehouse automation statistics also show that warehouses and distribution centers are embracing automation at an increasing rate. Of course, e-commerce sector growth is one of the driving forces behind this trend, along with rising labor costs, an emphasis on workplace safety, and growing demand for rapid order fulfillment.
Below are 30 e-commerce statistics that demonstrate how digitization is currently impacting the retail industry. They range from from warehouse automation trends to to new ways of order fulfillment in logistics and supply chain management. The business drivers underlying these statistics will ensure that automation deployments, including both fixed and mobile robotics systems, will continue to increase.
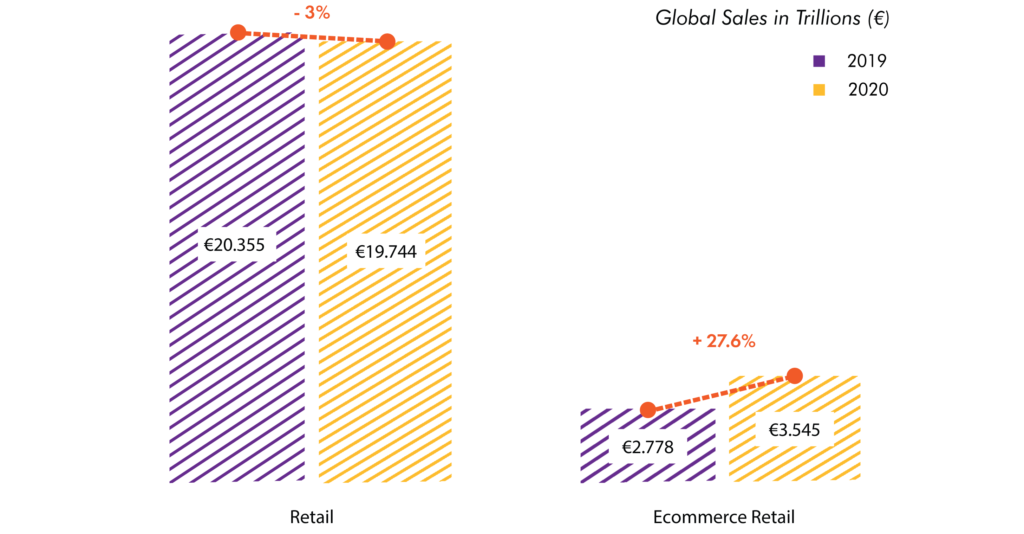
Figure 1: 2020 Global Retail Sales vs E-commerce Retail Sales (Source: emarketer.com)
General E-commerce Statistics
E-commerce revenues continue to increase worldwide. Costs are relatively low as e-commerce businesses require fewer staff members and they do not necessarily require a physical location — creating many opportunities for entrepreneurs.
- 2020 E-commerce Sales – Despite a decline in global retail sales, 2020 saw a substantial increase in e-commerce sales. According to eMarketer, worldwide retail e-commerce sales grew 27.6% in 2020, for a total of $4.27 trillion — compared to a 3% decline in total worldwide retail sales, dropping to $23.79 trillion (Figure 1).
- E-commerce Consumer Demand Booming – With 59% of the world having access to the Internet, online shopping is often the more convenient buying option. Moreover, it is expected that by 2040 more than 95% of all purchases are conducted via e-commerce.
- Global Increase in Digital Buyers – According to Statista, over 2.14 billion people worldwide are expected to buy goods and services online in 2021 — up from 1.66 billion in 2016.
- China Leads, Latin America Grows – Led by e-commerce subsidiaries of the Alibaba group and with an annual growth rate of 35%, China is also one of the markets with the fastest e-commerce industry growth. However, last year, Latin America stood out with the fastest growth — from 23.2% in 2019 to 36.7% in 2020 (Figure 2).

Figure 2: Leading E-commerce Markets in the World (Source: Business.com)
- B2B E-commerce Dominates – Despite being a tad slower to implement e-commerce, B2B brands are increasingly looking for digital solutions to boost sales — and with good reason… in 2019 the global B2B e-commerce market value was over six times that of the B2C market.
- Mobile Devices – It is projected that the total global retail e-commerce sales will reach $4.9 trillion by 2021 — of which mobile commerce is expected to take a market share of 72.9%. In addition, online shoppers make purchases via mobile more often than on PC.
- Good Social Media is Key – According to BigCommerce, e-commerce businesses that have at least one social media account have 32% more sales on average than online stores that do not utilize social media networks. Think about it: Facebook has 2.2 billion monthly active users — that is a huge audience for leveraging your brand — and on top of that, 70% of consumers search on Facebook and Instagram for products they wish to purchase.
The global warehouse automation market is expected to demonstrate tremendous growth in the upcoming years. This growth is highly influenced by the rise in e-commerce, the globalization of supply chain networks, the emergence of autonomous mobile robots (AMRs), and the importance of order fulfillment in logistics operations.
Warehouse Automation Statistics
Today, business practices are heavily influenced by the revolution of automation solutions, which work to meet consumer demand while keeping the cost of production and logistics down. As a result, versatile automation systems that operate in multiple environments are being adopted.
- Higher Levels of Warehouse Automation – The acceleration in e-commerce is driving higher levels of warehouse automation, along with information systems that support them. To fulfill orders efficiently and meet customers’ delivery expectations, as well as to adapt to rapid operational changes — such as during the Covid-19 pandemic — automation has been become a real game-changer.
- Rapid Growth for Warehouse Automation – The global warehouse automation market is expected to demonstrate tremendous growth in the upcoming years. According to Statista, the global warehouse automation market is predicted to increase from $15 billion in 2019 to $30 billion by 2026 (Figure 3). This growth is highly influenced by the rise in e-commerce, the globalization of supply chain networks, the emergence of autonomous mobile robots (AMRs), and the importance of order fulfillment in logistics operations.

Figure 3: Figure 3: Warehouse Automation Market Forecast 2019-2026 (Source ft.com)
- Covid-19 an Accelerant – Distribution Centers have seen a tremendous increase in sales since the beginning of the Covid-19 pandemic. According to the most recent report from Peerless Research Group, 10% of respondents have seen their e-commerce channel grow by 60% or more, and a combined 34% say e-commerce has grown by 30% or more since the beginning of the pandemic.
- Increased Automation Investment – Thanks to a positive economic outlook, an increasing number of warehouses and distribution centers are investing in robotics and automation. Logistics Management’s report of 2018 found that 42% of respondents were proceeding with investments thanks to the positive state of the economy — a 7% increase compared to 2017.
- AMRs Increase Productivity and Efficiency – Companies deploying AMRs and other robotic solutions in their warehouses see significant productivity improvements. More than 70% of order fulfillment operations and warehouses that deploy AMRs — especially retail and wholesale industries — have achieved double-digit improvements, stating that the main reason for using robotics is to improve the company’s overall efficiency and productivity.
- Addressing Workers Shortage – Data suggests that introducing AMRs in fast-growing warehouses and fulfillment centers is mostly a result of a shortage of workers, rather than a way to replace workers. For example, during the last five years, Amazon has adopted 200,000 mobile robots in its warehouses, while simultaneously increasing its workforce with the same numbers.
- Massive Increase in AMR Deployments – According to ABI Research, over 4 million commercial robots will be installed in more than 50,000 warehouses worldwide by the year 2025. This would be quite an increase from the existing 4,000 back in 2018.
- Commercial Service Robots – 9 out of 10 companies have indicated that they are planning to incorporate commercial service robots within their organization in some way. It is expected that in the United States alone, there will be roughly 23,000 robotic warehouses by 2025, compared to 2,500 back in 2018.
- Robot Shipments Up – Robot shipments in the warehousing and logistics industry are seeing tremendous growth. According to Omida’s Warehousing and Logistics Robots report, that growth will continue. The worldwide robot unit shipments for warehouses and logistics will reach 620,000 by 2021 — up from 40,000 in 2016.
Human error is the number one cause of fulfillment problems. Automation, including robotics systems, can reduce human error for fulfillment operations.
Order Fulfillment Statistics
Millions of packages are shipped worldwide on a daily basis. From fast-paced shipping to managing distribution centers and keeping customers satisfied, order fulfillment presents companies with many challenges.
- Fulfillment Efficiency is Critical – Order fulfillment is critical for customer satisfaction and retention. Data shows that 63% of consumers say that home delivery is the top purchase driver for online buying. In addition, 45% of online shoppers are unlikely to purchase from a store again after having received an item late.
- Speed and Ease Key – Shipping speed and easy delivery processes are key when it comes to generating positive customer experiences in the e-commerce sector (Figure 5). The top contributors to ensuring positive customer experience in e-commerce are fast shipping speed (62%), an easy delivery process (54%), and ample product information (53%). In addition, 80% of people discontinue doing business with companies due to poor customer experience!

Figure 5: Top Contributors to Positive Customer Experience (Source: Emarketer.com)
- The Cost of Human Error – Human error is the number one cause of fulfillment problems. According to a survey from Stitch Labs, 62% of respondents mentioned human error from manual process management as the number one root cause of inventory or fulfillment issues. Automation, including robotics systems, can reduce human error for fulfillment operations.
- Inventory Management – A comprehensive and accurate view of a warehouse’s inventory, as well as immediate updates on stock availability, are two of the most helpful tools for improving front-end operations. During Stitch Lab’s survey, 40% of respondents reported that consistent, on-time delivery of orders is the most essential factor in making happy, lifelong customers — which can be supported through automated inventory management solutions. In addition, having a clear overview also provides managers and business owners with more time to focus on high-level business strategies.
- Multiple Fulfillment Challenges – Processing time for outbound orders and system integration are two of the main difficulties merchants face with order fulfillment. In addition, 24.7% of merchants say that the biggest challenge their supply chain faces are delivery costs, while 12% of them are unprofitable simply due to distribution costs.
- LImited Warehouse Tracking – In 2018, only 35% of warehouses tracked their order cycle times using an automated system. The same study showed that nearly 50% of warehouses still tracked their order cycle times manually, whereas 19% did not track them at all.
- Shift To Outsourcing Fulfillment – According to a DHL report from 2019, 40% of companies are insourcing fulfillment, of which 6% are planning to switch to an outsourcing solution in the future. Another 18% will most likely outsource their fulfillment completely.
- Hybrid Solutions for Fulfillment – Combining insourced with outsourced resources seems to be the most popular approach. Nearly 50% of B2C respondents say that they will opt for a hybrid solution to order fulfillment — current strategies include having a dedicated e-commerce facility for online order fulfillment as well as having a multichannel facility that combines the inventory management of both online and in-store purchases.
Material Handling Statistics
Just as we have seen with the warehouse industry, the material handling industry is driven by the rising e-commerce sector. Keeping up with the trends in the online shopping industry, the material handling sector focuses its attention on developing and optimizing solutions for the warehouse- and supply chain ecosystem.
- More Material Handling Technology – The global market size of the material handling equipment industry is expected to rise steadily in the upcoming years. According to Fortune Business Insights, the market was valued at nearly $140 billion in 2018, more than €212 billion in 2019, and is now projected to reach $320 billion by 2027 — exhibiting a 5.4% CAGR during the forecast period.
- Asia and Europe Lead – The majority of material handling technology deployments are in Asia and Europe. According to Statista, Asia accounted for 44% of the global material handling equipment market in 2019, followed by Europe with a 33% market share.
- Material Handling Automation – The market for material handling automation solutions is large and growing. The market size of the automated material handling equipment industry is valued at $43.54 billion in 2021 and is expected to increase to $76.69 billion in 2026, with a CAGR of 12% during the forecast period — that’s a steeper increase than seen in the non-automated material handling equipment market.
- More Mobile Robots – The adoption of mobile robots is increasing rapidly across industries, bringing huge transformative change. The mobile robotics market in material handling and logistics is estimated to be valued at $75 billion by 2027 — this number is even expected to have more than doubled by the year 2038.
- Reliability and Flexibility Valued – There is a growing demand for reliable and flexible automated systems that improve operations and productivity in various retail applications. Technologies like AGVs and Warehouse Management Systems (WMS) are gaining more popularity as they offer a variety of benefits to improve operational efficiency and productivity — such as low errors and costs as well as more accurate picking and packing. This, in turn, will increase the need for universal fleet management systems.
- E-commerce holds the largest market share in the material handling equipment industry. In 2018, approximately 15% of material handling equipment revenues were for e-commerce applications, and this figure is expected to expand at a CAGR of 8% until 2025.


